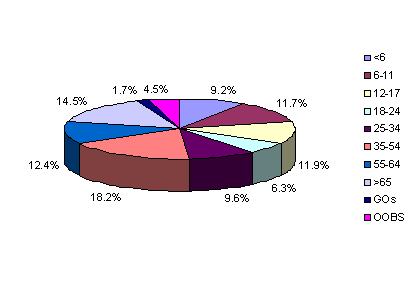
I received some interesting statistics today. The table below contains the averages of Sunday School enrollment by age group for the six state conventions in Kentucky, Tennessee, South Carolina, North Carolina, and Virginia (GOs=general officers and OOBS=other ongoing Bible study):
| Age Group | Enrollment | % of Total |
| Total |
2,253,676
|
|
| <6 |
207,427
|
9.2%
|
| 6-11 |
264,737
|
11.7%
|
| 12-17 |
267,515
|
11.9%
|
| 18-24 |
141,472
|
6.3%
|
| 25-34 |
216,255
|
9.6%
|
| 35-54 |
410,837
|
18.2%
|
| 55-64 |
280,554
|
12.4%
|
| >65 |
326,530
|
14.5%
|
| GOs |
37,604
|
1.7%
|
| OOBS |
100,745
|
4.5%
|
How does your Sunday School compare? I plan to do additional research to see if statistics vary by church size, church location, community growth, or church growth. Allow me to do a little informal research first. Check out your own statistics and compare them? Then press the comments button below or email me to let me know how close your Sunday School age group percentages are to those above.
In advance of doing further research, I would imagine that the demographics of the community would play into the statistics for the church. But I wonder if a growing church will tend to have a different distribution of preschoolers, children, youth, and young adults. What do you think I’ll discover? Stay tuned, and I’ll let you know. Make disciples. Be revolutionary!
Leave a Reply